Revenue Assurance Platform
Understand what friction costs you.
Know what to fix first.
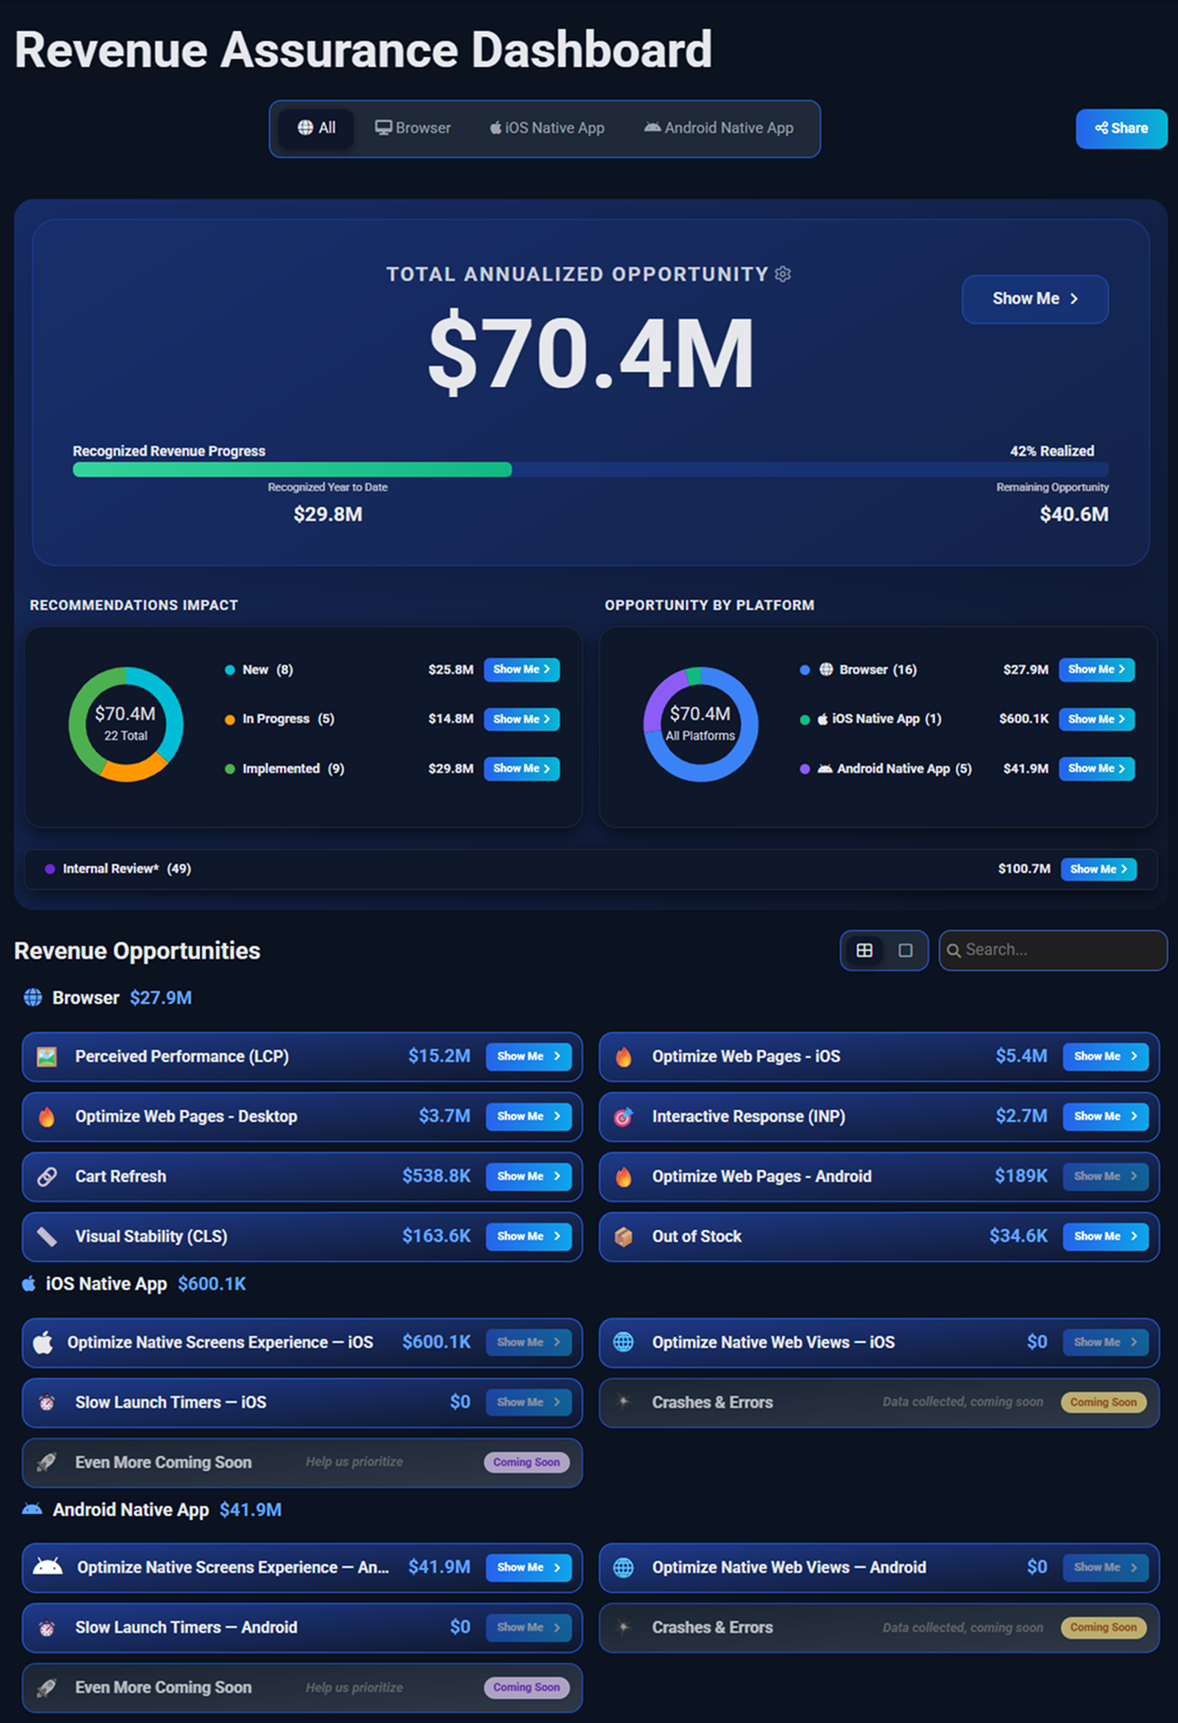
Blue Triangle connects digital friction to revenue using your own customers’ behavior. See where slow pages and frustrating experiences put conversion at risk, prioritize the fixes with the greatest opportunity, and assess the results after your team makes a change.
Trusted by enterprise brands















What customers say
Blue Triangle is a unique optimization tool for me. I've never worked with any other solution that provides so much data about the business value of website performance and user experience. The biggest difference is the business opportunity reporting.
Blue Triangle is the tool that has really helped focus every conversation we have around the customer experience and what we're doing to make that experience frictionless.
Blue Triangle has helped us recover so much revenue that people almost don't believe us. The secret lies in the way they pinpoint the exact friction issues costing the most money, and give us the full picture behind why it's happening.
From customer experience to revenue decisions.
Experience analytics shows where customers struggle. Ordinary dashboards show speed, conversion, and revenue. Blue Triangle connects them: what happened during a visit, whether that visit converted, and the revenue it generated. Our Conversion Rate Curve compares slower page loads with a well-sampled group of faster loads on the same page and device, using your customers’ data. That turns slow page loads into revenue-opportunity estimates your team can act on.
Give product, eCommerce, marketing, and engineering teams a shared answer to one question: what should we fix next, and why?
See how Blue Triangle works →Built on your data. More useful over time.
Blue Triangle’s tag collects first-party experience measurements from your website and connects them to conversion and revenue from the same sessions. Over time, that creates a history of how your customers respond to digital friction. Your own traffic and results make the analysis specific to your business.
That measurement history is the foundation of the revenue model. A screenshot or a prompt cannot supply the sessions, conversion history, and analysis behind it.
Start with Blue Triangle’s tag. Build your measurement history.
Start by adding Blue Triangle’s tag to your website. It collects the experience, conversion, and revenue data needed to build your measurement history. We check the collected results against your analytics to establish a reliable starting point. Revenue-opportunity estimates use enough slower and faster page loads on the same page and device to make a useful comparison. Mobile apps use a separate software integration.
Our measurement powers our revenue model.
Our Conversion Rate Curve uses your measured page-load time and conversion patterns to estimate where faster pages could create the greatest revenue opportunity. Your team gets a practical way to rank improvements using your own customers’ behavior, rather than applying an industry average to your site.
Read the Conversion Rate Curve explanation →
Your customers’ behavior is the starting point.
Compare slower and faster page loads on the same page and device to see where slow pages may be costing you. The dollar figures are page-load estimates for prioritizing work. Traffic mix, buyer intent, and other business factors still matter; the model does not guarantee a particular return.
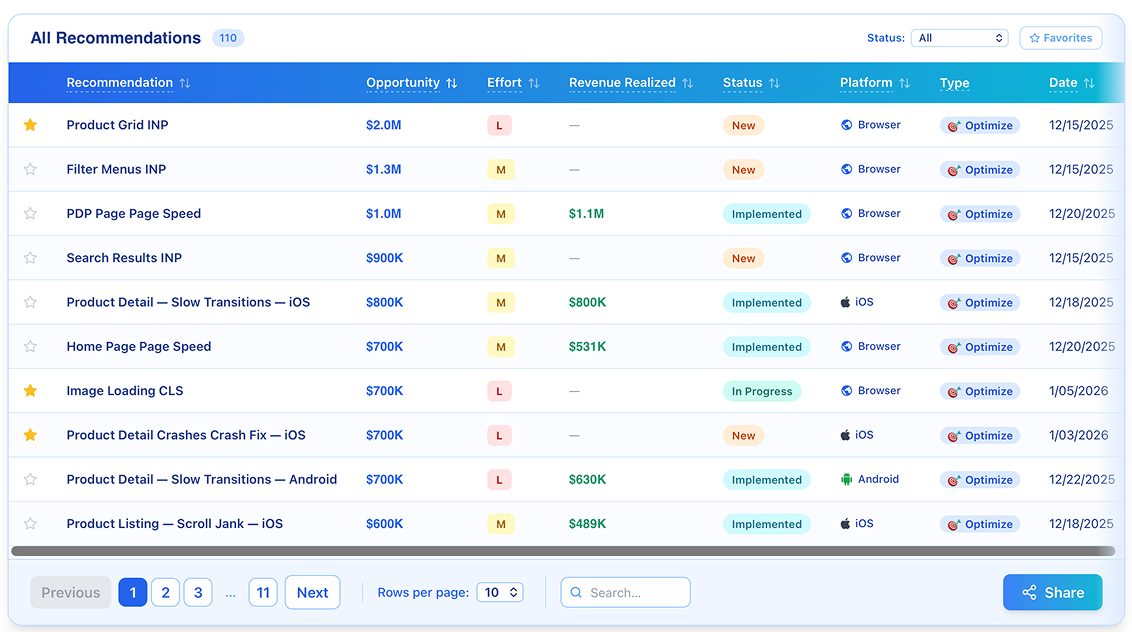
Recommendations checked against your data.
AI recommendations are checked against the customer’s own measured data and our documented performance rules. Claims the data doesn’t support are flagged and held back, never rewritten. A solutions architect has the final say. A human review scorecard sits behind the automated judge, and a weekly scorecard tracks how recommendations perform against each check. Your team decides what to ship, then uses Blue Triangle to assess what changed.
Understand what changed—and what contributed.
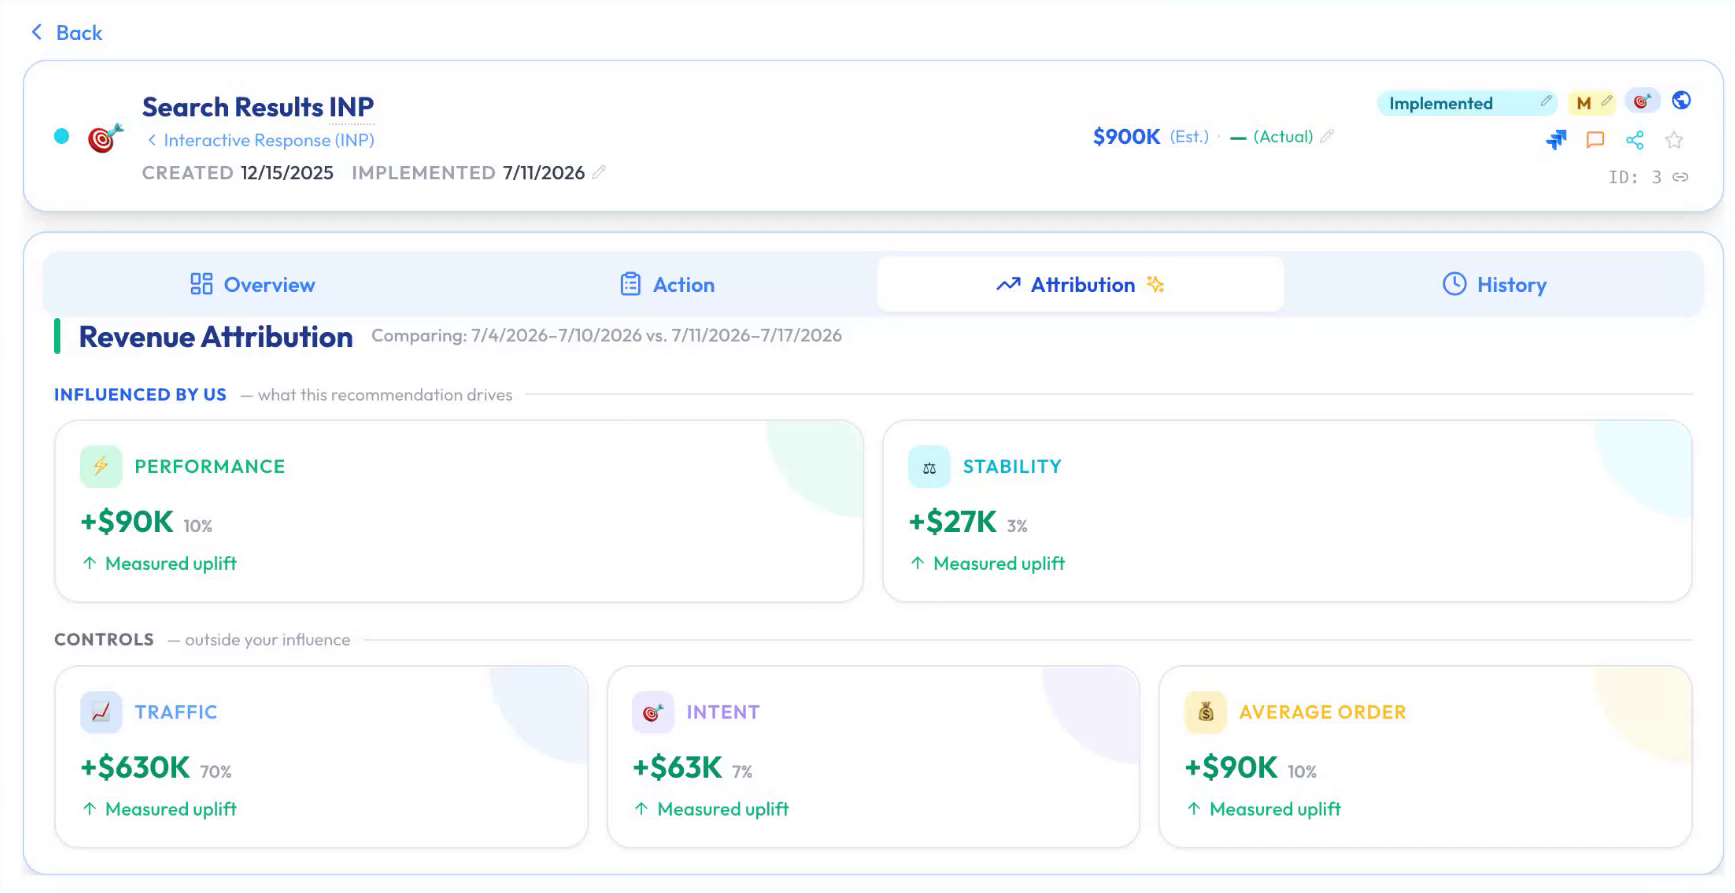
After your team makes a change, Blue Triangle helps assess its estimated contribution to revenue. The attribution view helps separate experience changes from shifts in traffic, average order value, and other business factors, though it can’t fully separate promotions or seasonality. It estimates contribution; it does not claim that one fix caused all of the change.
Closed-loop Revenue Assurance
- QuantifyPrice friction on your data
- ResolveFix what matters most
- ValidateAssess what contributed
Homepage walkthrough
See the capabilities
Measure, Predict, Implement, Share, and Assess — how Blue Triangle connects experience, conversion, and revenue on your data.
Numbers shown in the walkthrough are demo examples, not a customer case study.
Get your free analysis What the free Friction Quantified Analysis includes →
Your assistant asks. Blue Triangle measures.
Ask an everyday question: “What did slow pages cost us in conversions yesterday?” Blue Triangle’s connector brings your measured sessions, history, and revenue analysis into supported assistants, including Claude and Cursor. It uses the Model Context Protocol, an open standard that lets an assistant request data from another system. The assistant can explain priorities and help draft a summary for your team. Your team takes action, then uses Blue Triangle to assess the result.
The assistant makes your data easier to use. Blue Triangle supplies the measurements, keeps the history, and runs the revenue analysis. Together, they help your team move from a question to a better-informed decision. An assistant reading a webpage or screenshot does not have that underlying data.
Read the August 2026 connector announcement →A customer example you can inspect.
U.S. Auto Parts could see performance problems in other monitoring tools. Blue Triangle helped its engineering team identify which pages carried the largest revenue opportunity. After adding the tag, the team prioritized the shopping cart and homepage, removed or delayed nonessential third-party content, and improved two slow files. The August 2018 case study reports a four-second improvement in DOM Interactive—a browser timing measure—and load-time improvements of 35% and 49% on those files.
The case study reports that revenue opportunities were identified within a week of adding the tag. Sheng-Te Yang, then Senior Director of Engineering, said the team identified and realized incremental revenue opportunities within two months. Read the case for the work performed and results reported; it does not publish a recovered dollar total. The customer comments near the top of this page describe how those teams use Blue Triangle; they are not measured revenue totals.
Read the dated customer case →Start with a free Friction Quantified Analysis.
Get a first look at where digital friction may be tied to revenue on your site. We use the traffic, page-load, and revenue data you can share to help identify opportunities worth investigating. The published offer is intended for qualifying sites with at least one million monthly page views, where transactions have a revenue or business impact. No purchase is required, and the findings are yours to keep. Request the analysis, or start with a demo to see how Blue Triangle works.
Get your free analysis