During the holiday rush, every shopper matters
Holiday Preparedness Ebook
Optimize the customer journey before the eCommerce event of the year.

The Frictionless Experience: The podcast where we slay friction one episode at a time / Listen to the podcast

Quantify by page lost revenue that can be recaptured from removing friction
Dive deeper into the problem to uncover hidden issues and deploy the perfect fix.
Validate with indisputable proof that your optimizations achieved desired business outcomes.
Expert Strategies to Create Frictionless User Experiences that Increase Conversions and Customer Loyalty
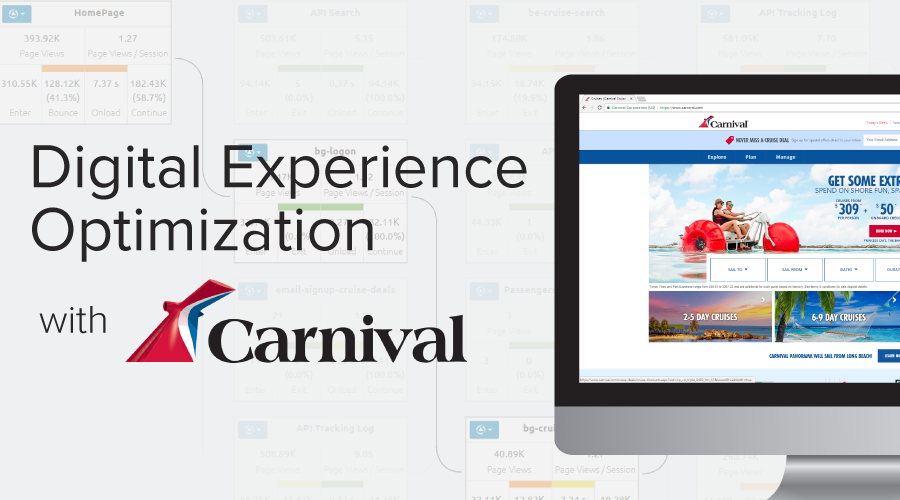
Carnival Cruise Line is the most popular cruise brand in the world and carries nearly 6 million passengers per year.
Erick Leon is the company's Senior Performance & Monitoring Architect. He is responsible for optimizing Carnival.com's digital experience and bridging the gap between the Carnival's Development, Marketing, Analytics and Operations teams. We recently sat down with him to discuss how he analyzes and optimizes Carnival's digital experience with Blue Triangle.
1: Understanding the impact of our website’s digital performance on our revenue.
2: Onboarding the proper visualization tools and partners.
3: Building a performance culture within the enterprise.
Before, it was more challenging to see how our marketing content and UI affected the overall user experience. We want to captivate our audience and bring forward the best website presentation possible, especially if someone is visiting our site from a marketing campaign.
Moving forward, we have to look at the revenue performance metrics to make proper decisions as to when campaign optimization is good for us and for our customer base.
Before and after a release, we have a better visualization not only into our code base but also into our UX through both Real User Monitoring (RUM) and Synthetic Monitoring metrics.
We understand the impact content, analytics, and marketing teams have on our site’s performance and have built a better performance centric partnership.
We have evolved beyond just reporting on server metrics and response times.
We can now look at our campaigns’ successes and failures. We can look at landing pages and customer journeys. Why is that important? It really helps us understand where our customers are leaving our site and where in our customer’s path we can improve.
We are now able to focus on the pages that need to be addressed and optimized first. Around 20% of our pages generate 80% of our revenue, so now we have visualization on that. That is very powerful for us.
Our reporting today is real-time.
We no longer have to wait for data to aggregate in three or four hours. This gives us the capacity to make real-time marketing and IT decisions.
Yes, it provides a multi-dimensional view of performance.
We analyze Real User and Synthetic analytics. We look at performance throughout the customer journey. We know how third-party tags are affecting performance on our site.
Prior to Blue Triangle, it was a lot harder from the performance team perspective. It was solely dependent on the team that owned it which was either marketing or analytics. Blue Triangle now gives my team the visualization so we can be more proactive in identifying quickly the revenue performance of any campaign.
For sure. I think the valuable metrics here are correlating exit rates with page load times.
When you notice a page that is exiting at 100%, you can quickly look at what is causing that exit rate. For example, could it be a 14-megabit image? Could it be something that was thought to be the right presentation but was really more hindrance than a value-add to the user?
Optimize the customer journey before the eCommerce event of the year.