
Website load time benchmarks have been published by technology companies and research organizations over the years and are used as KPIs for brands of all sizes. (i.e. 47% of customers expect a web page to load in 2 seconds or less)
Google, Soasta, and Hubspot are among those that have recently published "optimal" site speed numbers...and developers live and die by them.
So should your load time targets be determined by one number from one study?
Following optimal load time benchmarks can lead development teams down a path of wasted time and resources with minimal short term and long term success.
For example, one eCommerce site (they requested to be anonymized) almost wasted $1.4M and 3 months of development time speeding up their Product pages to the 2-second Google benchmark. Blue Triangle's analysis found that speeding up those pages would not improve revenue and conversion rates, but speeding up their Home page would.
Once the retailer optimized their Home page instead, their sales improved by 8% over the next 30 days.
I've measured performance and business metrics from billions of user experiences and have found that there is no accurate or actionable optimal load time benchmark. Here are 3 reasons why you should ignore them:
- Optimal load times are different between brands and webpages. (i.e. Home page, Product pages, Category pages)
- Optimal load times are different across devices. (desktop, tablet, mobile)
- Performance isn't always everything. Some webpages can load slower than others without hurting conversions and revenue.
What is optimal load time?
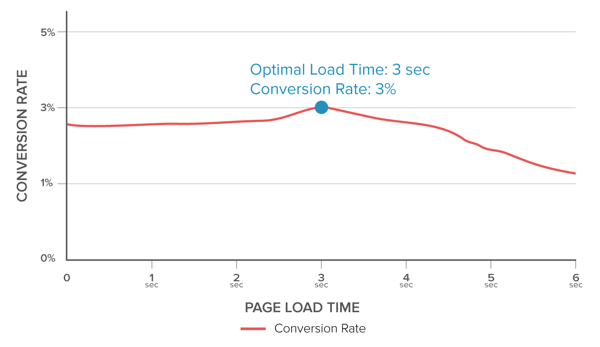
Blue Triangle defines optimal load time as the speed at which the highest percentage of users convert.
So if shoppers who experience a 3 second load time make a purchase 3% of the time and shoppers who experience a 2 second load time make a purchase 2.8% of the time, the optimal load time is 3 seconds. If the site was any faster than 3 seconds on average, there would be no additional business benefit.
We can visually determine the optimal load time by identifying the peak of the conversion rate by page load time curve.
Reason 1: Optimal load times are different between brands and webpages.
Let’s start by comparing the optimal Home and Product page load times between two competing clothing retailers:
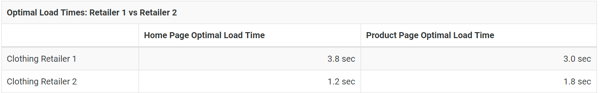
The graphs below visualize how page load time impacts conversions for both retailers.Clothing Retailer 1's shoppers are 142% more patient across these two pages.
Clothing Retailer 1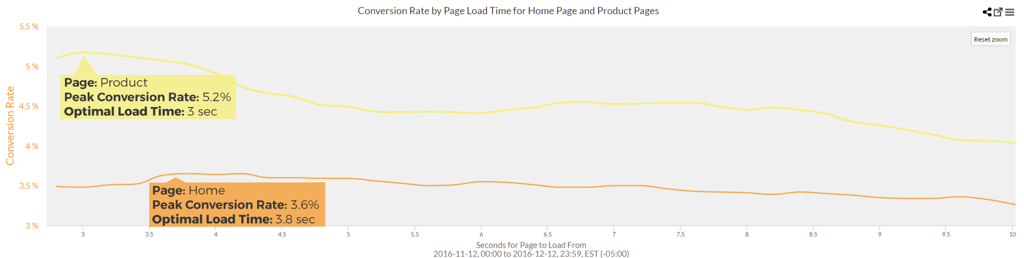
Clothing Retailer 2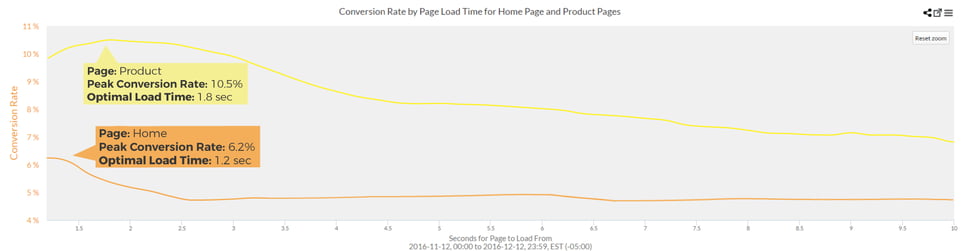
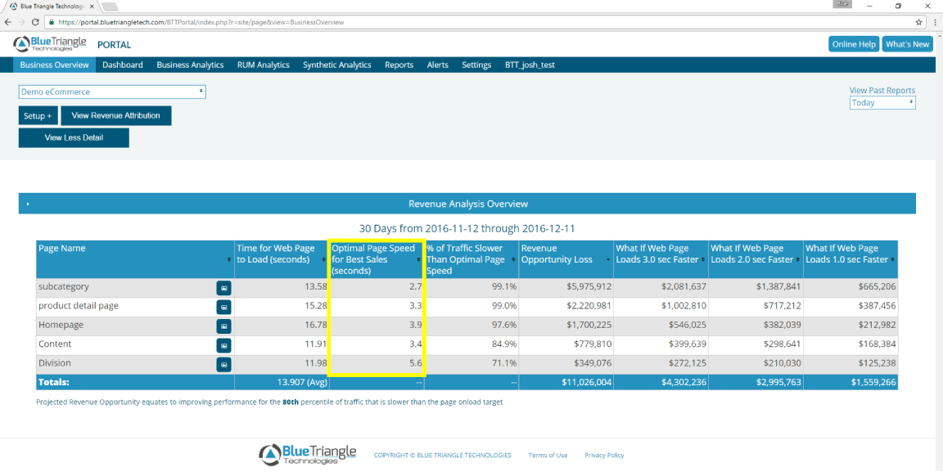
Notice the differences in optimal load times for another retailer in our Business Overview Report:
Ignore the benchmarks. Your brand and your web pages are unique.
Reason 2: Optimal load times are different across devices. (desktop, tablet, mobile)
This one's a no-brainer. The patience of your shoppers is largely dependent on what device they are on, and most load time benchmarks do not take this into account.
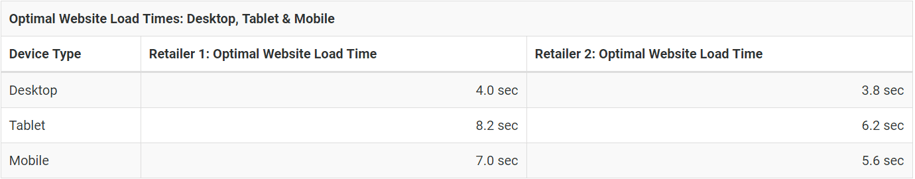
Below are the optimal load times by device for two different Internet Retailer Top 20 eCommerce sites, based on 244 million shopping experiences.
Reason 3: Performance isn't always everything. Some webpages can load slower than others without hurting conversions and revenue.
Each site has different optimal load times across devices, fluctuating by 4.2 seconds for Retailer 1 and 2.4 seconds for Retailer 2. Tablet users are the most willing to wait for both sites.
Faster speeds do not always result in better business results, especially if the aesthetics of a page are sacrificed.
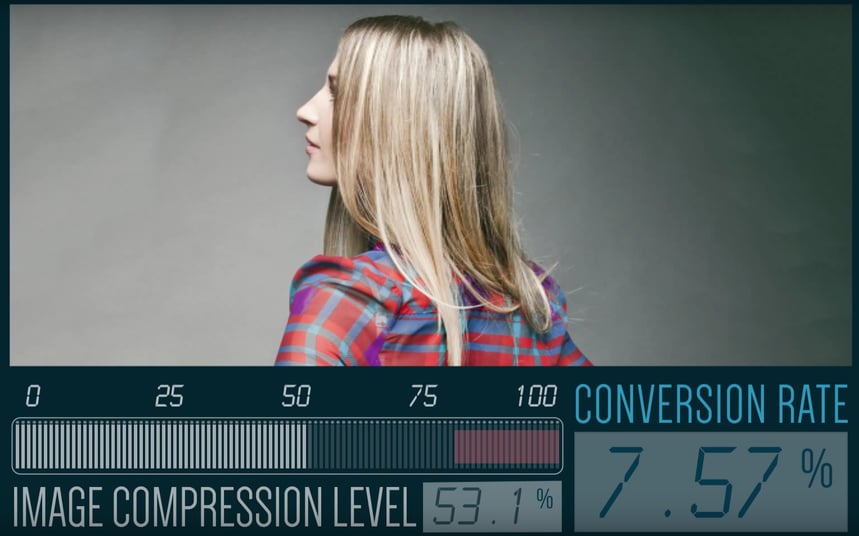
One of our customers compressed images across all of their Product pages to improve page load time. The performance results were outstanding, but conversion rates dropped significantly because the quality of the product images declined.
With Blue Triangle's analysis, they were able to determine the perfect image compression level for highest conversions - 53.1%. Performance and aesthetics became perfectly balanced.
Faster isn't always better. Performance isn't always everything.
Let's take a second look at the Blue Triangle Business Overview. If any of these pages were sped up faster than their optimal speed, no additional revenue would be made.
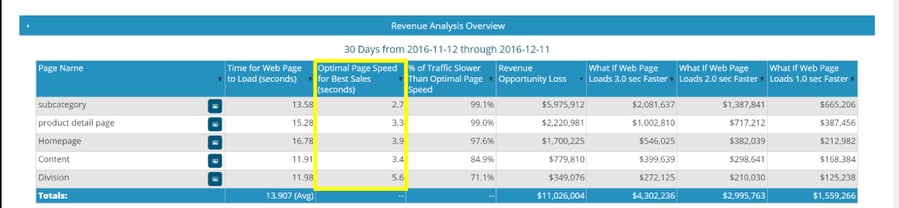
At a 5.6-second optimal speed, the Division page can be twice as slow as the Subcategory page without hurting sales and conversions.
Load time benchmarks do not address the constant balance that needs to exist between performance and aesthetics. Certainly some pages may need to load at Google's 2-second benchmark but others can afford to be 2x, sometimes even 3x slower.
What are my optimal load times?
This question can be answered in 2 weeks or less with Blue Triangle's web performance management solution. We leave the optimization guesswork behind and provide online businesses with a page load time road map to revenue.

During the holiday rush, every shopper matters
Optimize the customer journey before the eCommerce event of the year.