When you find millions of dollars in web performance-related opportunity sitting on your websites, you take it. And that’s exactly what Sheng-Te Yang and his team at U.S. Auto Parts did.
About U.S. Auto Parts
U.S. Auto Parts is a leading retailer of aftermarket auto parts. The company owns three eCommerce brands that contribute to a +$300M revenue stream.

Sheng-Te Yang is US Auto Parts’ Senior Director of Engineering. He manages a 200+ person technology team responsible for the entire company’s eCommerce development.
But don’t let Sheng-Te’s technical title fool you. He is focused on driving revenue and is successfully bridging the gap between IT and the business.
The Problem
Sheng-Te was tasked to improve performance on their CarParts.com and Auto Parts Warehouse sites. However, the company had a challenge calculating exactly how much load times affected their online revenue, or which areas of the site had the highest revenue opportunity.
Finding a Solution
Sheng-Te and his team had experience with performance monitoring tools like New Relic, AppDynamics, and WebPageTest. These tools found a laundry list of website issues, but never gave the revenue perspective needed to budget and prioritize fixes.
Enter Blue Triangle. Blue Triangle helps online businesses optimize digital experience where it matters most to revenue.
How Blue Triangle Works
Step 1: Prioritize Optimizations
Quantify where performance-related revenue opportunities exist, down to an accurate dollar amount on every web page.
Step 2: Find & Optimize
Identify page-level enhancements that will directly improve digital experience and revenue.
Step 3: Validate
Measure the business and performance impact of optimizations immediately.
Note: Although optimizations were made on the Auto Parts Warehouse and CarParts.com websites, the focus of this case study is Auto Parts Warehouse.
Step 1: Prioritize Optimizations
To find revenue opportunity, the Blue Triangle tag was easily deployed via Tealium Tag Manager.
No coding. No configuration. No custom events.
“Without any configuration, Blue Triangle found revenue opportunity throughout our sites, allowing us to prioritize our efforts on the areas with the greatest ROI. That was amazing.”
-Sheng-Te Yang, Senior Director of Engineering at U.S. Auto Parts
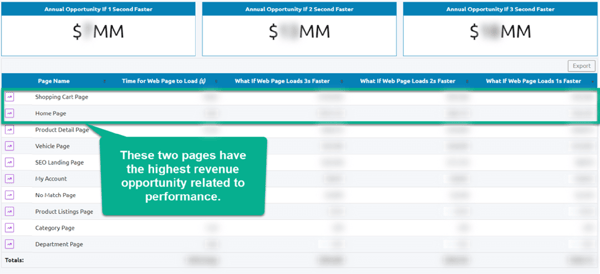
Within a week, the Auto Parts Warehouse was able to identify revenue opportunity on their site.
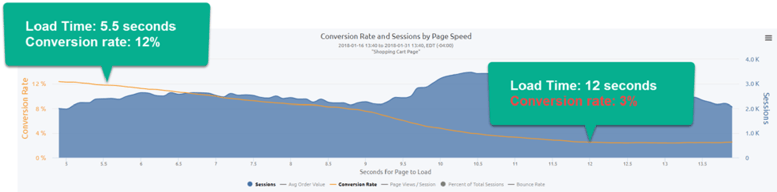
The company was missing out on thousands of customers because of slow performance. This is evident in the conversion rate by page speed curve below:
They had to act quickly, starting with the Shopping Cart Page, then the Home Page.
Step 2: Find & Optimize
Shifting gears – improving the digital experience
Knowing the pages with the highest revenue opportunity, the technology team went to work.
Removed third party content
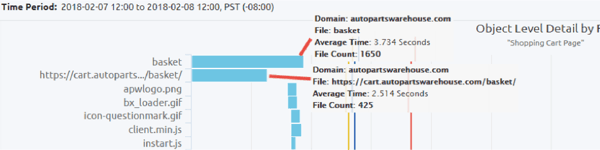
The team identified and removed extraneous third party content from the Shopping Cart and Home Pages, including two payment gateways (Visa and Amazon).
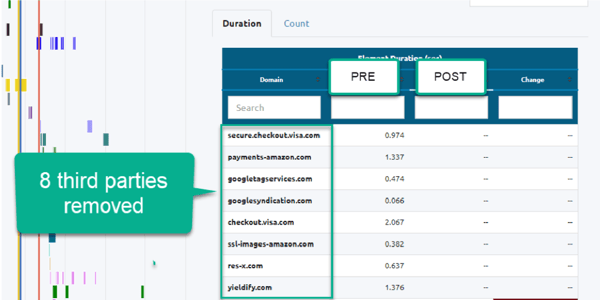
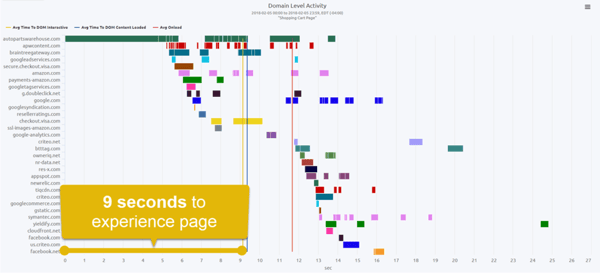
Although some third party content was removed, there was still work that needed to be done since it was taking over 9 seconds just to experience the Shopping Cart and Home pages.
The DOM Interactive (the yellow line in the graph below) is the metric browsers report to signify this moment.
Content from Amazon, Google, and ResellerRatings was holding up shoppers from experiencing the site. Content non-essential to the initial loading of the page.
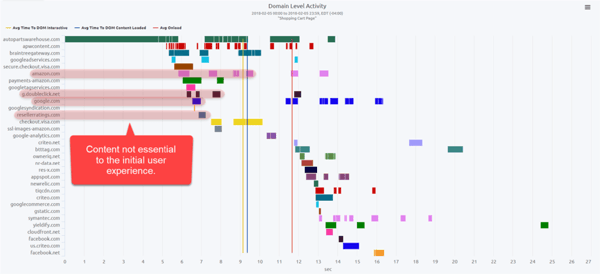
The solution was simple: defer the loading of non-essential content.
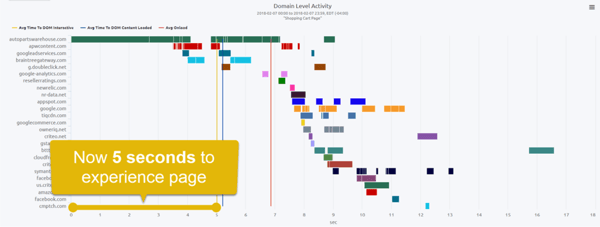
In other words, the team changed the content order so that critical business content (like the “Buy it Now” button) was loaded first.
The result? The time to experience the page (DOM Interactive) improved by 4 seconds!
Optimized back-end code
Two files critical to the construction of the pages’ HTML were loading slowly due to back-end issues. These were delaying the rest of the page from loading.
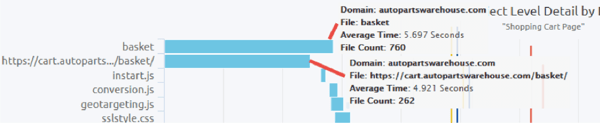
After some back-end code optimizations, load time for these files improved by 35% and 49%, respectively!
Step 3: Validate
By following Blue Triangle’s roadmap to revenue, U.S. Auto Parts was able not only to improve page speed but also quantify the dollar value of the improvements they made.
Customer experience improved. Revenue improved.
"We were able to identify and realize incremental revenue opportunities in just 2 months with Blue Triangle."
-Sheng-Te Yang, Senior Director of Engineering at U.S. Auto Parts
Ready to see Blue Triangle in action?

During the holiday rush, every shopper matters
Optimize the customer journey before the eCommerce event of the year.