
Say, what? Slow is OK? Are you crazy?
Well, now that I have your attention, let’s dig in.
As many well-respected and well-known experts in the web performance community have researched and written about, web site speed is one of the single most important levers that impact revenue performance for today’s eCommerce businesses.
We’ve all seen the charts. You know, the ones where conversion rates decline as page load times increase.
Like this one:
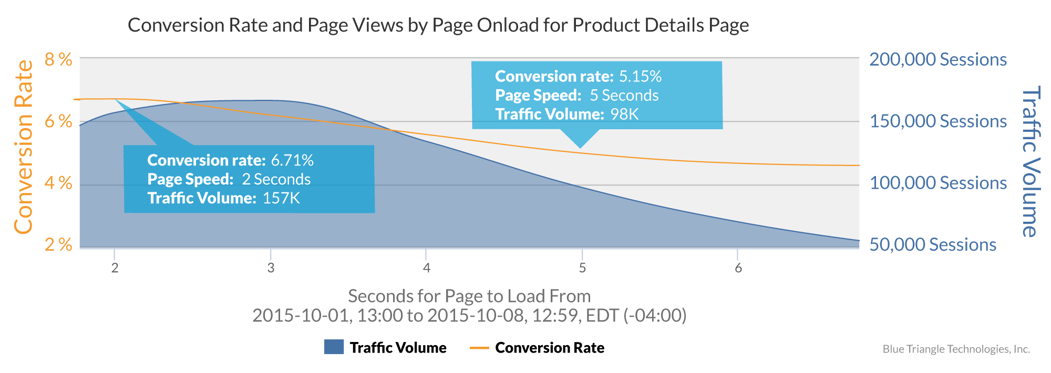
But I argue that this doesn’t tell the whole story. I’ve always wondered why these charts don’t go further to the right. Most every chart I’ve seen from any vendor or any web performance analyst always seems to stop just after the conversion rates and revenue start to trend downward.
I’ve always assumed it was because there’s nothing to see there. (Also known as, “These aren’t the droids you’re looking for.”)
But, wait, let’s analyze what’s behind the curtain and see if there’s anything that we might be missing, or as my favorite college football analyst would say: “Not so fast my friend.”
It turns out there is a treasure trove of data that should be part of any revenue or web performance conversation.
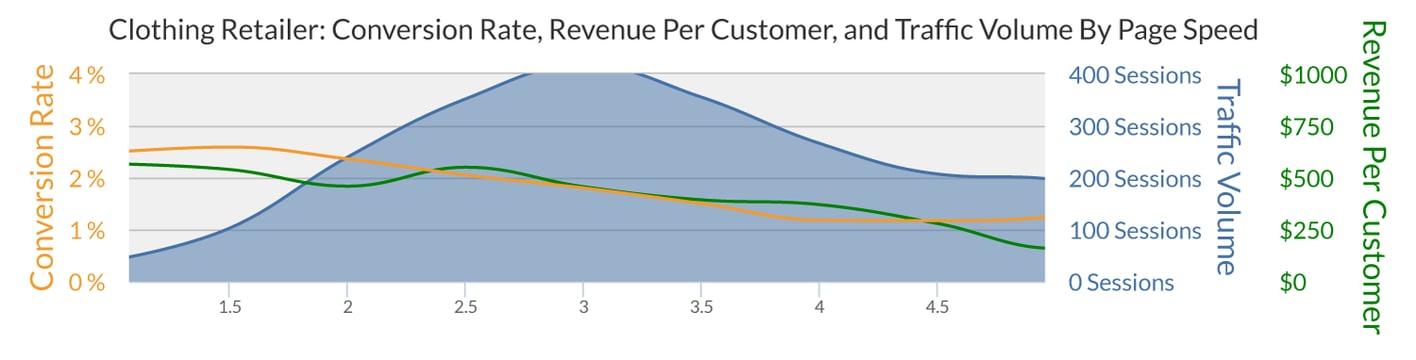
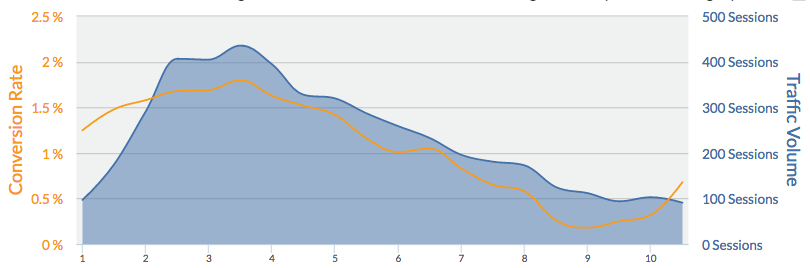
Let’s look at an example below of a luxury clothing retailer. Initial analysis shows nothing out of the ordinary, or so it seems. As page load times increase, revenue per customer and conversion rates fall. Nothing new there.
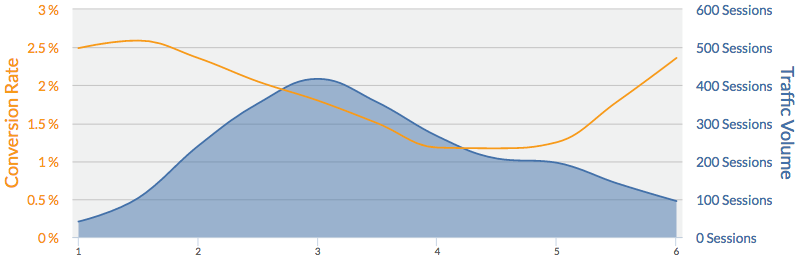
But what does this look like if we analyze ALL the data. That is, don’t stop analysis when the trends start to drop off, rather, continue the analysis until the sessions nearly reach 0.
In this example (see chart below), you’ll see that conversion rate increases after a sharp decline around the 5 second mark. Why?
This is where web performance analysis cannot be performed in a vacuum by IT, like it typically is. Rather, the focus on web performance really should be a part of a constant analysis of overall revenue performance with the heavy involvement of the business, especially the marketing teams.
In this instance, the analysis done by the business (for this retailer, the business consists of marketing and IT, or as I’ve coined it, #MarkIT), determined that this trend actually made sense. Why, you ask?
Easy. When the #MarkIT team analyzed web performance against what was happening at that moment (a marketing campaign), it made perfect sense. Users were tolerant of the slowness of the site because of the campaign.
The marketing group was running a loyalty program “flash sale” via email, where discounts for a signature luxury clothing line were launched “on the clock”. This sale started at 6 AM EST with discounts of 50% off. When the clock ticked to 7 AM EST, the discounts dropped to 40% off. At 8 AM EST, 30% off, until the discounts finally went to 0% at 11 AM, thus ending the sale.
Makes perfect sense now. But without the #MarkIT team looking at all the data from a business perspective, this information most likely would have been lost in the shuffle instead of analyzed and acted upon for the next campaign.
Think this only applies to retail?
Nope. Below, here’s an example from a major travel site. They were running a winter vacation package special from their web site specifically for their loyalty members.
As we expect to see, the conversion rate and active sessions drop significantly at 4 seconds. Incredibly, we start to see an even more significant uptick in conversion rate after 9 seconds, and even 10 seconds!
Enter User Tenacity
When we address this with our customers’ #MarkIT teams, we now have a term for what this phenomenon is. Or should I say we now use a term that was first coined by my @BlueTriangle colleague, @Alanleeharris: User Tenacity.
The common theme is that your customers are so loyal, and/or the offer is so great, that the users will tolerate slowness to complete their transaction. It’s like seeing the waiting room clock on TicketMaster when trying to buy Hamilton tickets the moment they go on sale.
Takeaway
So what does all this mean, and what should you do about it?
Simple.
We still aim for optimal revenue and web performance.
However, we should be analyzing the entire spectrum of the user experience. In addition, there should be a group or team responsible for monitoring, measuring and optimizing the user experience across the entire performance spectrum. This is the #MarkIT team. Aligned with the business. Armed with the technology to drill into the business revenue performance as well as web performance - ideally in the same solution. (And not just bounce rate, page load time and other IT metrics. Business metrics such as exit rates, promotional campaign path analysis, revenue by campaign and campaign path, etc.
During the holiday rush, every shopper matters
Optimize the customer journey before the eCommerce event of the year.