The Blue Triangle team was hard at work over the holiday season getting ready for our January 2019 release. And boy, did they deliver.
Here’s what the January 2019 release includes:
New Features (broken out by product)
Real User Monitoring
Find revenue opportunity by device and page – instantly.
The speed of your site matters to your revenue. See where speed improvements will bring you the most revenue, now in one view – down to every device and web page.
Attribute revenue gain or loss to a performance change.
This used to live on the last screen, but we thought it deserved more love.
New Dashboard – RUM Performance Detail
Instantly trend and analyze the performance of every page on your site on one dashboard. If you have multiple dashboards, you can cycle through them at a set interval.
Learn More
Tag Governance
Trend the performance first and third-party domains and their resources
Chances are, over 60% of your website is comprised of third-party domains and their resources (like JavaScript tags and CSS files).
Measuring domain and resource performance is critical to have proper Tag Governance. Blue Triangle now shows you all your domains, the pages they’re loading on, and the resources they are loading.
Learn More
Synthetic Monitoring
New Dashboard – Synthetic Performance Detail
We built this for Real User Monitoring, so why not Synthetic Monitoring too?

Synthetic Monitors Log
Go ahead and yawn…but you’ll thank us when you have multiple people managing your synthetic monitors.
Learn More
New Metrics
We added 3 new Google Lighthouse metrics to our platform, giving you more ways to analyze your site’s performance. The definitions below are provided by Google.
Time to Interactive
Measures how long it takes a page to become interactive. "Interactive" is defined as the point where:
- The page has displayed useful content, which is measured with First Contentful Paint.
- Event handlers are registered for most visible page elements.
- The page responds to user interactions within 50 milliseconds.
First Contentful Paint
The time from navigation to the time when the browser renders the first bit of content from the DOM. This is an important milestone for users because it provides feedback that the page is actually loading.
First Meaningful Paint
The paint after which the biggest above-the-fold layout change has happened, and web fonts have loaded.
Improvements
Filters
You can now quickly add or remove popular filters at the top of each page. And the main filters list now slides in instead of popping over so it won’t impede your view. Pretty cool, right?
Dashboard
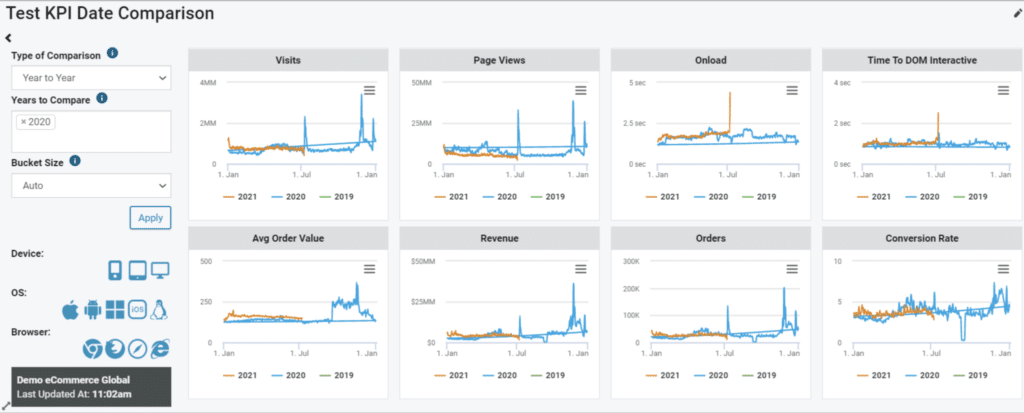
The KPI Date Comparison Dashboard Widget now has 2 new panels – Onload and Time to DOM Interactive. Track performance and revenue side-by-side!
A Note of Thanks
To our customers who provided us with feedback prior to the release – thank you! We look forward to continue working with you in the future.
Not a Blue Triangle customer? Click here to learn more about our platform.